
Decoding the Numbers That Move Markets: A Quick Guide to Financial Indicators
A practical introduction to the stock, bond, and commodity indicators that show up in the news every day
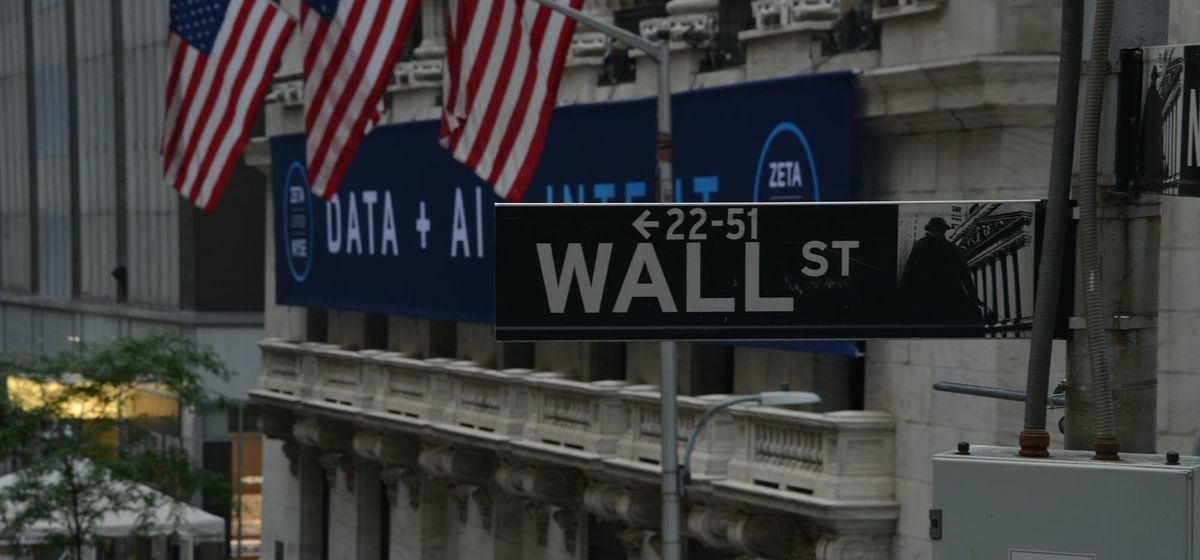
Every morning, before the second cup of coffee even kicks in, the markets are already talking: an index climbs 200 points, gold shifts to a certain price per ounce, a barrel of oil changes value. This guide organizes those numbers into four broad groups — equities, government debt, commodities, and cryptocurrency — so anyone can understand what they mean and why they get so much attention.
Part 1: The Big Three Stock Indexes
Before looking at each index individually, it's worth understanding the key difference between them: how their value is calculated. There are two main methods — price-weighting and market-cap-weighting — and that technical distinction explains a lot of why these indexes sometimes move in different directions on the same day.
The elder statesman: Dow Jones Industrial Average
This index groups together 30 companies considered "blue chip" — large, well-established firms. Its quirk is that it weights by share price rather than by the company's actual size, which creates an odd distortion: a one-dollar move affects the index the same way regardless of whether the stock is worth $20 or $400, even though that change doesn't mean the same thing in relative terms. On top of that, when a company carries out a stock split (dividing its shares to lower the per-share price), its weight in the index can shrink even though the company's total value hasn't changed. With over a century of history behind it, the Dow is widely respected as a market barometer, though covering just 30 companies makes it far from comprehensive.
The broad giant: Nasdaq Composite
Unlike the Dow, this index groups together thousands of securities (stocks, real estate investment trusts, depositary receipts). It weights by market capitalization — that is, by a company's total value (share price multiplied by shares outstanding). That means technology companies, which make up a large share of its total value, end up with outsized influence. Because it also includes many small, speculative companies, it tends to be more volatile than its peers.
The most-cited benchmark: S&P 500
This index groups together 500 large companies trading on the NYSE or Nasdaq, selected under strict criteria: a minimum market cap of roughly $8.2 billion, a U.S. headquarters, and sustained profitability over several consecutive quarters. It also weights by market capitalization (adjusted for shares actually available to the public), which tilts it toward the very largest companies. Thanks to its broad sector coverage, it's generally considered the best barometer of large U.S. companies — though that same weighting method can inflate the index if certain stocks become overvalued.
Part 2: The Debt Barometer — the 10-Year Treasury Note
The U.S. government issues this debt instrument to fund itself, and its yield (the return the market demands for lending money to the Treasury) serves as a reference point for setting other interest rates across the economy. Here's how it works: the Federal Reserve auctions the bonds to investment banks, which then resell them to other investors; the note pays interest every six months and returns the full principal once the ten-year term ends. It's considered a safe haven, with a particular quirk: the more people want to buy it, the lower its yield falls — to the point where some investors end up paying more than the note's face value at maturity, in exchange for the peace of mind it offers.
Part 3: Commodities That Track the Economy's Pulse
Oil (WTI)
West Texas Intermediate crude is one of the world's three major oil benchmarks, extracted mainly in Texas and prized for its high quality in gasoline refining. In financial markets, no one buys physical barrels directly — instead, futures contracts trade on the New York Mercantile Exchange, and at expiration those contracts can convert into actual oil, be cashed out, or roll into a new contract. Its price reacts to global economic activity, supply and demand, and geopolitical forces; the pandemic, for example, triggered a historic collapse in prices.
Gold
With thousands of years of history as a store of value, gold is priced in U.S. dollars per ounce worldwide. It can be bought physically (bullion or coins) or through financial instruments like futures, exchange-traded funds, or shares in mining companies. Even though no currency today is backed by the gold standard, many investors still turn to it as a haven during times of economic or geopolitical uncertainty, since it tends to hold its value over time.
Part 4: The New Arrival — Bitcoin
Created in 2009 by a person (or group) using the pseudonym Satoshi Nakamoto, bitcoin is a decentralized digital currency with no central bank backing it. New units are released ("mined") on a fixed schedule until reaching a hard cap of 21 million. There's no physical version: every transaction — buying, selling, or creating new units — gets recorded on a public ledger distributed across thousands of computers, making it extremely difficult to manipulate. Its supporters value that it operates outside government-issued currencies and carries low transaction fees, but its price is notably volatile, and since it's still a young asset, governments and regulators are still working out the rules that will govern it.
Part 5: And Individual Stocks — What Are They?
A stock is a slice of ownership in a company. There are two main types: "common" shares, which carry voting rights on corporate decisions, and "preferred" shares, which don't vote but get priority when it comes to collecting dividends (periodic payments to shareholders). Companies first issue shares through an initial public offering (IPO) to fund their growth, and can issue more later to raise additional capital. An individual stock's price doesn't just track the broader market — earnings reports, product launches, leadership changes, or even public statements from executives can send it soaring or tumbling.
In short: these indicators — the three stock indexes, the 10-year note, oil, gold, and bitcoin — work like a dashboard for the economy. None of them tells the whole story on its own, but together they offer a reasonably complete picture of where money is moving each day.